To President elect Obama: congratulations. You have won an impressive victory. However, there is much work to be done. Most people who voted felt the economy was the most important issue. There is a good reason for that: the economy is in terrible shape and stands a high possibility of getting worse.
Let’s start with employment.
The year over year rate of job creation has been dropping for the last two years. In addition, each month of 2008 has seen continuing job losses.
In addition, the unemployment rate has been increasing since early 2007.
These charts tell us the employment situation has been deteriorating for some time. In other words we have a medium-term trend in place. And that trend is getting worse. The following charts are for the number of people unemployed for 5 – 14 weeks 14 or more weeks and 27 or more weeks. Note that the number of people in each category has been steadily increasing the beginning of 2007 and has really taken off in 2008.
And as this chart from the blog Calculated Risk shows, unemployment claims are clearly at recessionary levels:
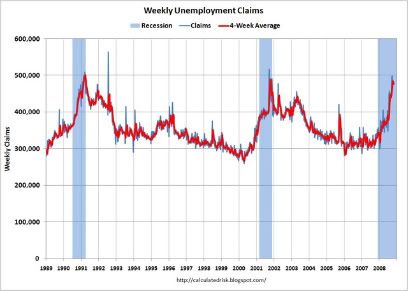
The charts above indicate very clearly that getting people back to work should be a top priority.
But this isn’t all. In fact, it’s only part of a larger problem. Manufacturing has been dropping as well. Consider the following charts:
Overall industrial production has been dropping for nearly a year:
And the national level ISM manufacturing number has been declining since the beginning of 2004 and just recorded its lowest level in that time period:
As a result, the US is using less of its total manufacturing capacity:
In other words, US manufacturing capacity is in poor shape as well.
Now we move to housing which I will break down into new and existing homes. New home sales comprise about 10% of the existing home sales market. Therefore they are less important. But we’ll go over them anyway. (The following graphs are from the blog Calculated Risk)
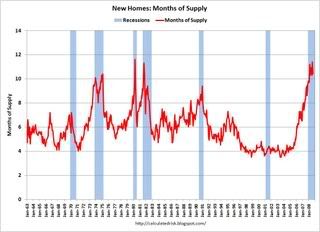
The good news with new home sales is total inventory has been dropping for a while now:
However, sales have been falling off a cliff:
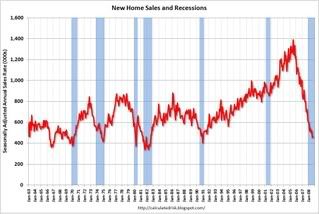
This means there is still a ton of inventory available at the existing sales pace.
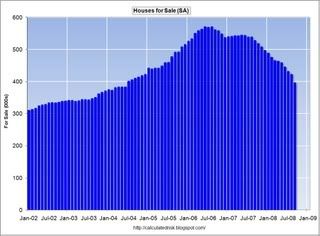
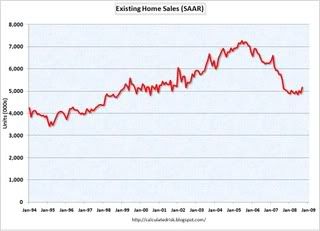
On the existing home sales front we have a slightly different story. The sales pace seems to have leveled off (at least for now):
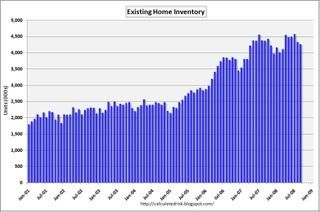
But the total homes available for sale is still increasing:
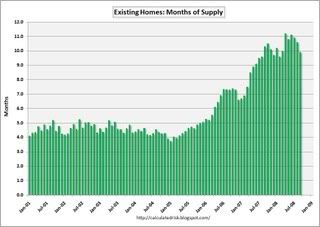
Leading to a higher and higher "months of inventory available at the current sales pace":
The bottom line with new and existing home sales is simple: there is still a ton of inventory to clear. As a result, prices are dropping big time and probably have a long way to go:
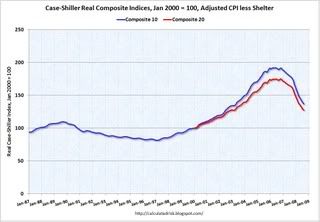
This discussion of the housing market leads perfectly to a discussion of the financial meltdown. As the chart of housing prices above indicates housing was clearly in a bubble over the last 8 years. To finance that bubble the US consumer added a ton of mortgage debt to his balance sheet. Here is a chart from the blog Prudent Bear that shows the huge increase:
All of the debt had to go somewhere. Thanks to securitization everybody and their brother wound up owning mortgage-backed debt. However a large number of these mortgages started to go bad. As a result:
Financial firms worldwide have posted almost $700 billion in credit-related losses and writedowns since the beginning of 2007, in the worst economic crisis since the Great Depression.
This is the reason Congress passed the $700 billion dollar bail-out package about a month ago. And considering the size of the losses we’ve seen from the financial sector another bail-out may be in the cards.
And this is on top of a terrible overall federal fiscal situation. President Bush decided to once again try and prove that supply side economics works. Unfortunately reality entered. Here's a reading of the last 8 years of total federal debt outstanding from the Bureau of Public Debt:
09/30/2008 $10,024,724,896,912.49
09/30/2007 $9,007,653,372,262.48
09/30/2006 $8,506,973,899,215.23
09/30/2005 $7,932,709,661,723.50
09/30/2004 $7,379,052,696,330.32
09/30/2003 $6,783,231,062,743.62
09/30/2002 $6,228,235,965,597.16
09/30/2001 $5,807,463,412,200.06
09/30/2000 $5,674,178,209,886.86
The current total is $10,566,146,196,490.58 In other words, federal finances are in terrible shape.
There is also the issue of personal savings which are now (and have been) hovering around 0%-2% for the last several years.
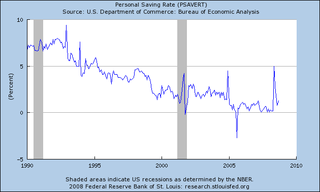
Basically Americans are spending everything they make.
And finally there is the trade deficit which has really gotten out of control over the last decade:
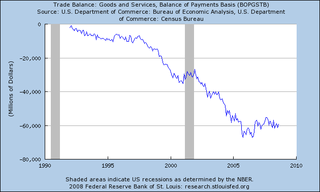
Simply put, the economy is in terrible shape. Job losses are mounting manufacturing is slowing and there is no bottom in sight for housing. The federal government is issuing tons of debt, the US consumer is not saving anything and the trade deficit is at a scary level.
However, there are solutions to there problems. And that’s what we’ll tackle in the next article.
